dsh-tool-call-stats
by disyli
进程内工具调用统计:提供 `tool_stats` 工具,按工具汇报调用次数、失败次数与平均耗时。
Per-process tool-call statistics: a `tool_stats` tool reporting per-tool call counts, error counts, and average durations.
安装
dsh plugin --profile web add github:disyli/dsh-tool-call-statsGitHub 源码安装:首次需按提示配置 allowBuilds 构建授权后重试
安装与环境配置指引、插件开发教程见 DSH 中文社区文档 ↗
安装即在你的机器上以你的权限运行第三方代码——它可读写文件、使用凭据、访问网络,DSH 的工具审批不会为插件代码加沙箱。「检测到 manifest」仅代表发现 dsh.bundle / dsh.plugin 清单,不构成兼容性或安全审查;安装前请审阅源码,不熟悉的插件先在不含密钥的环境试用。
预览截图
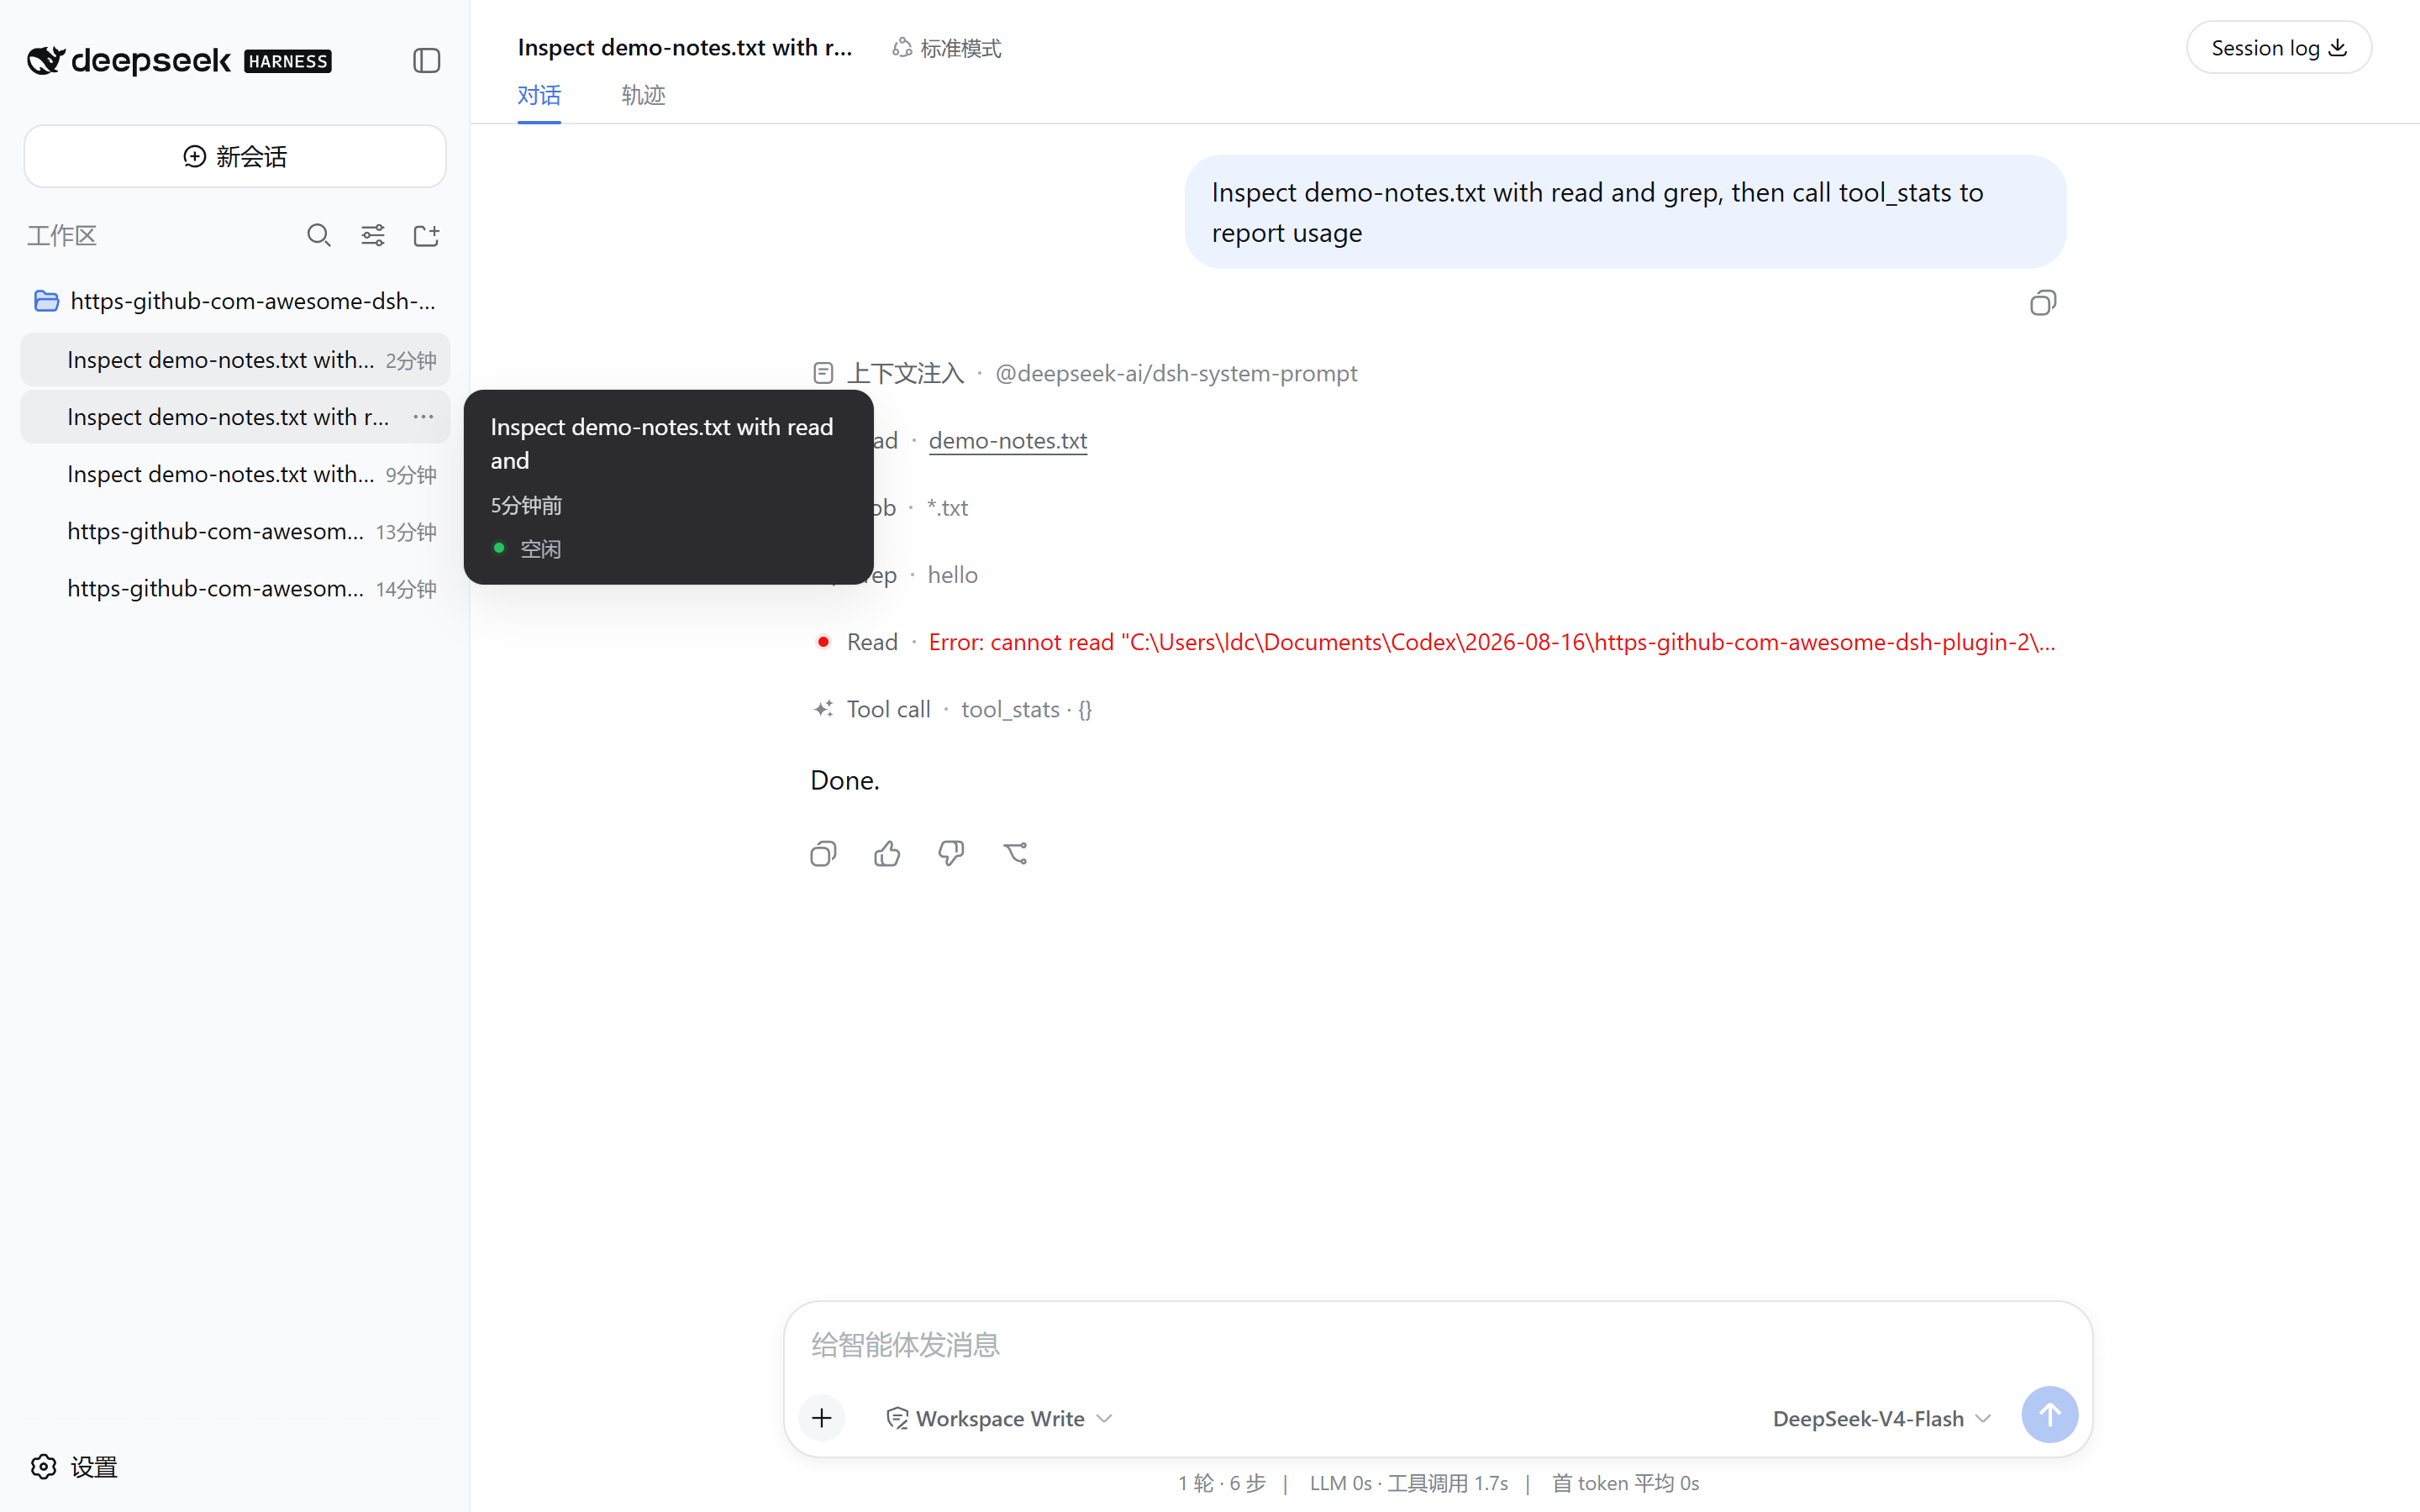
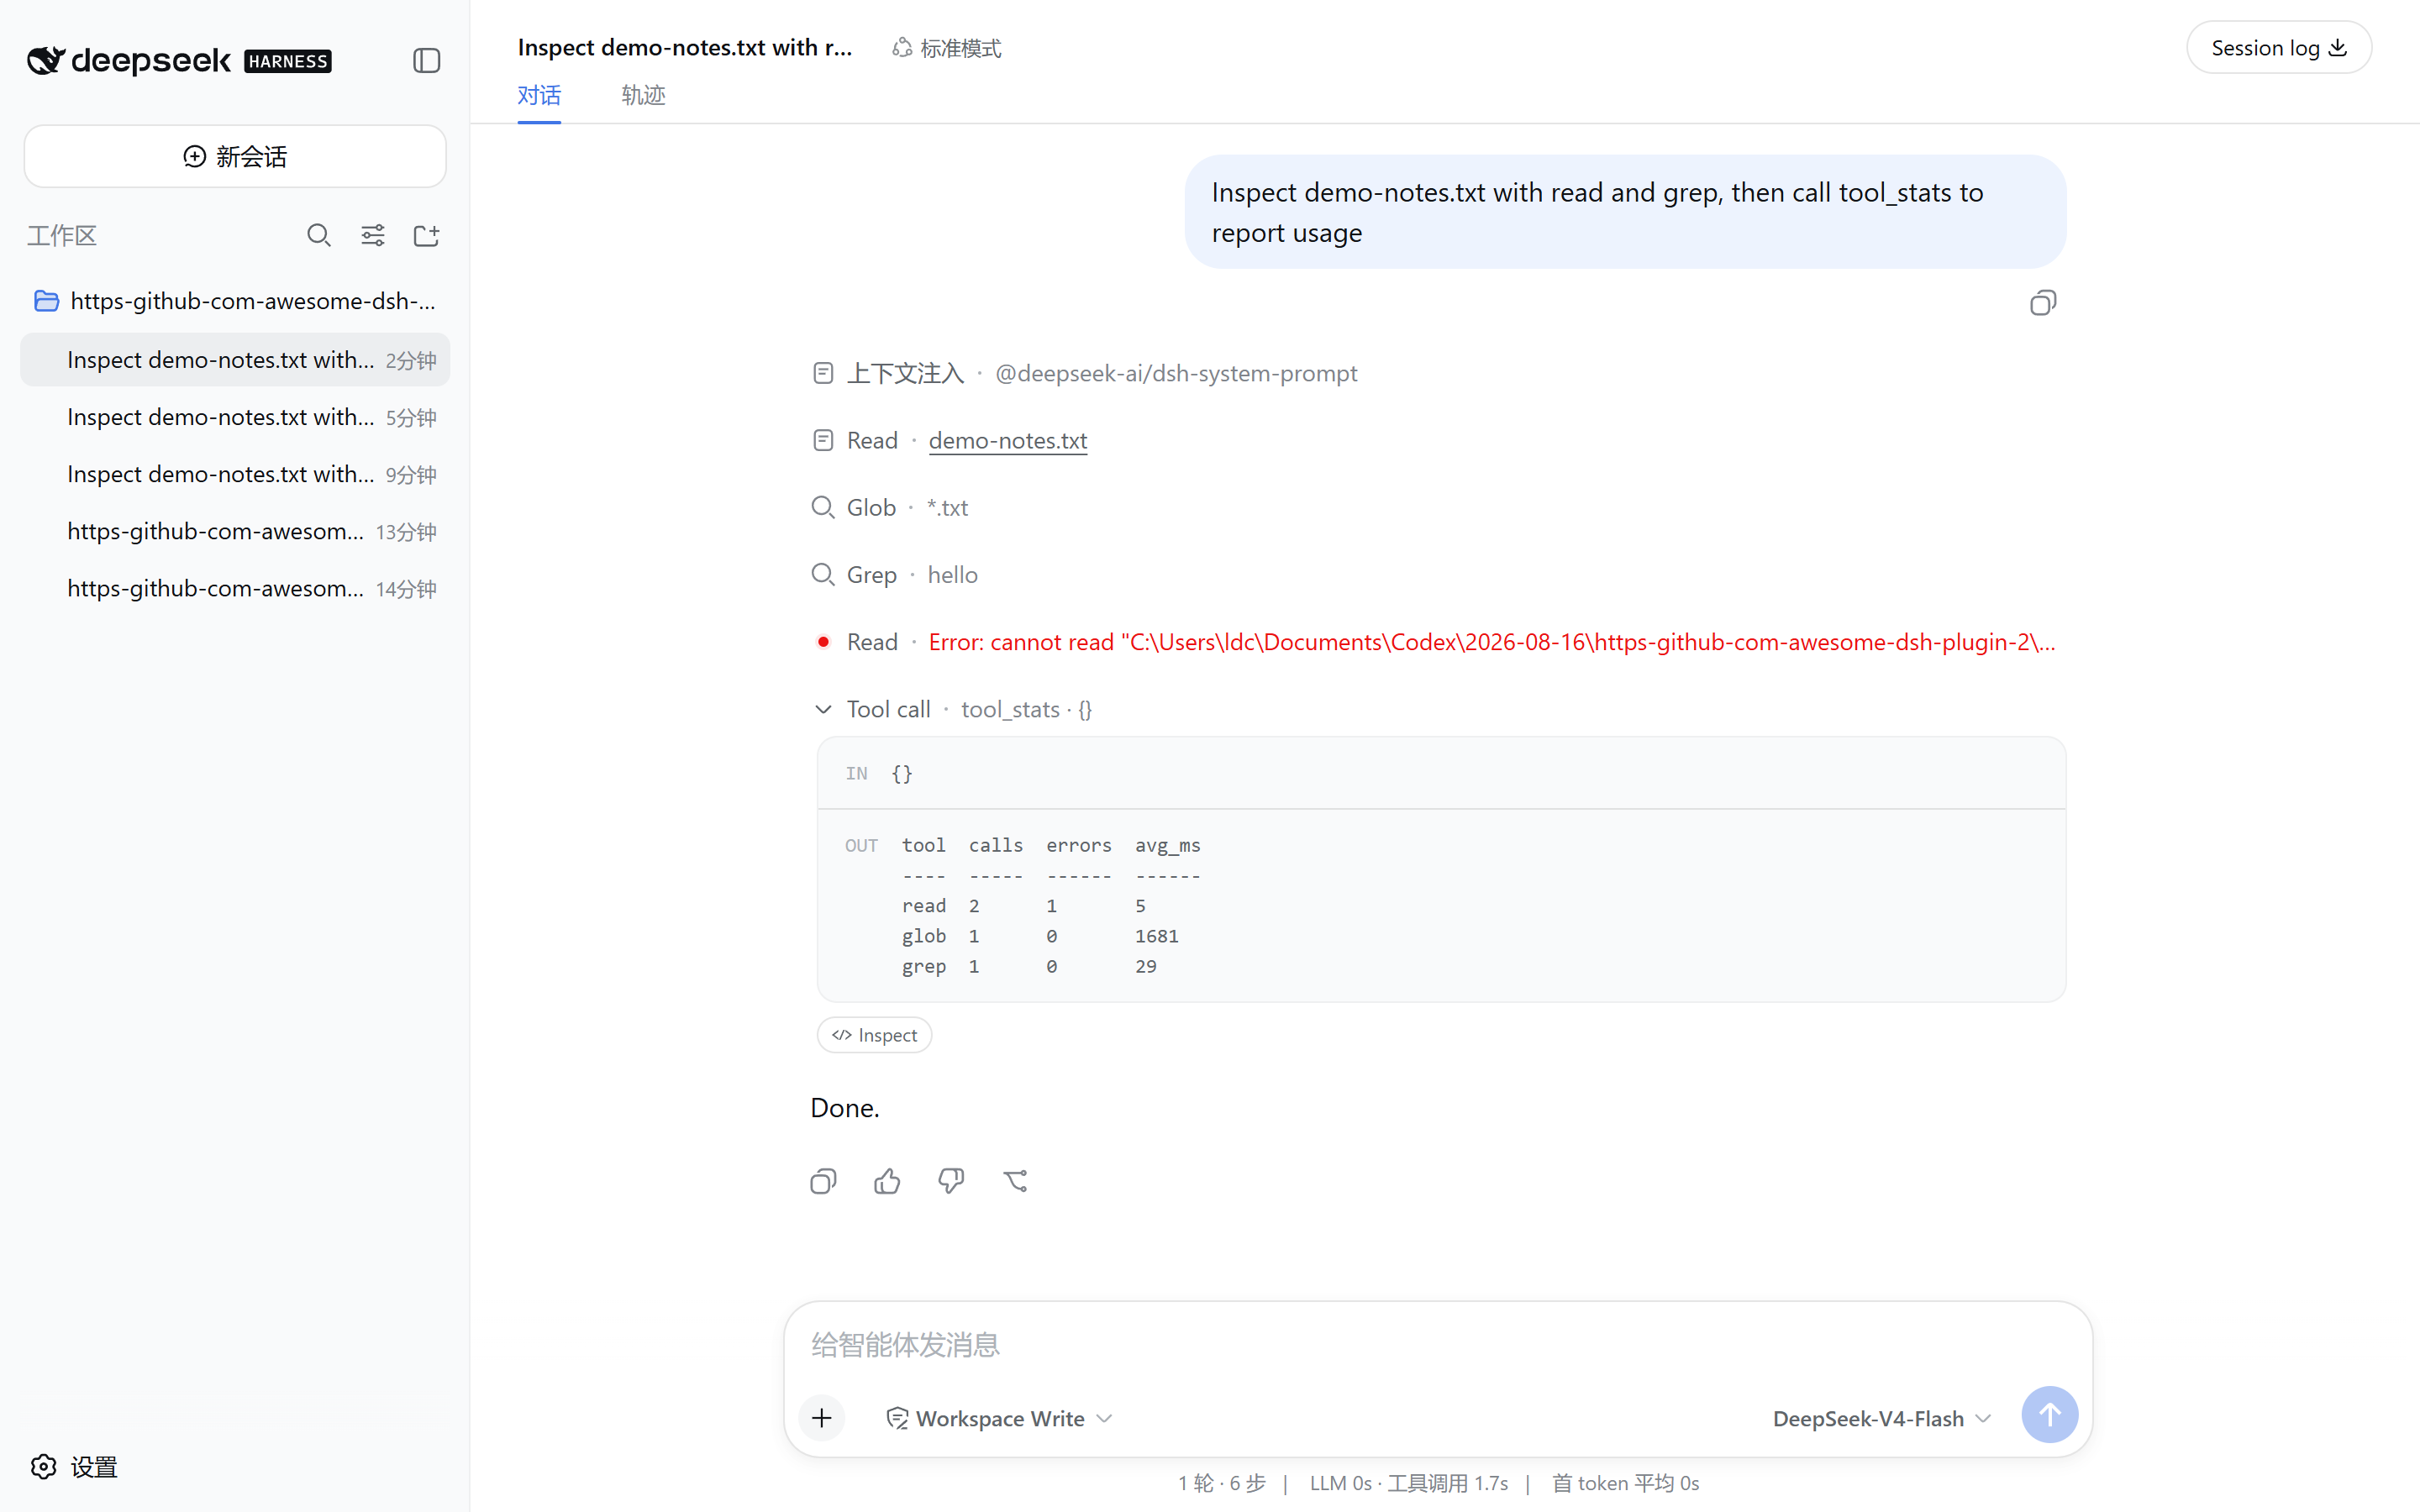
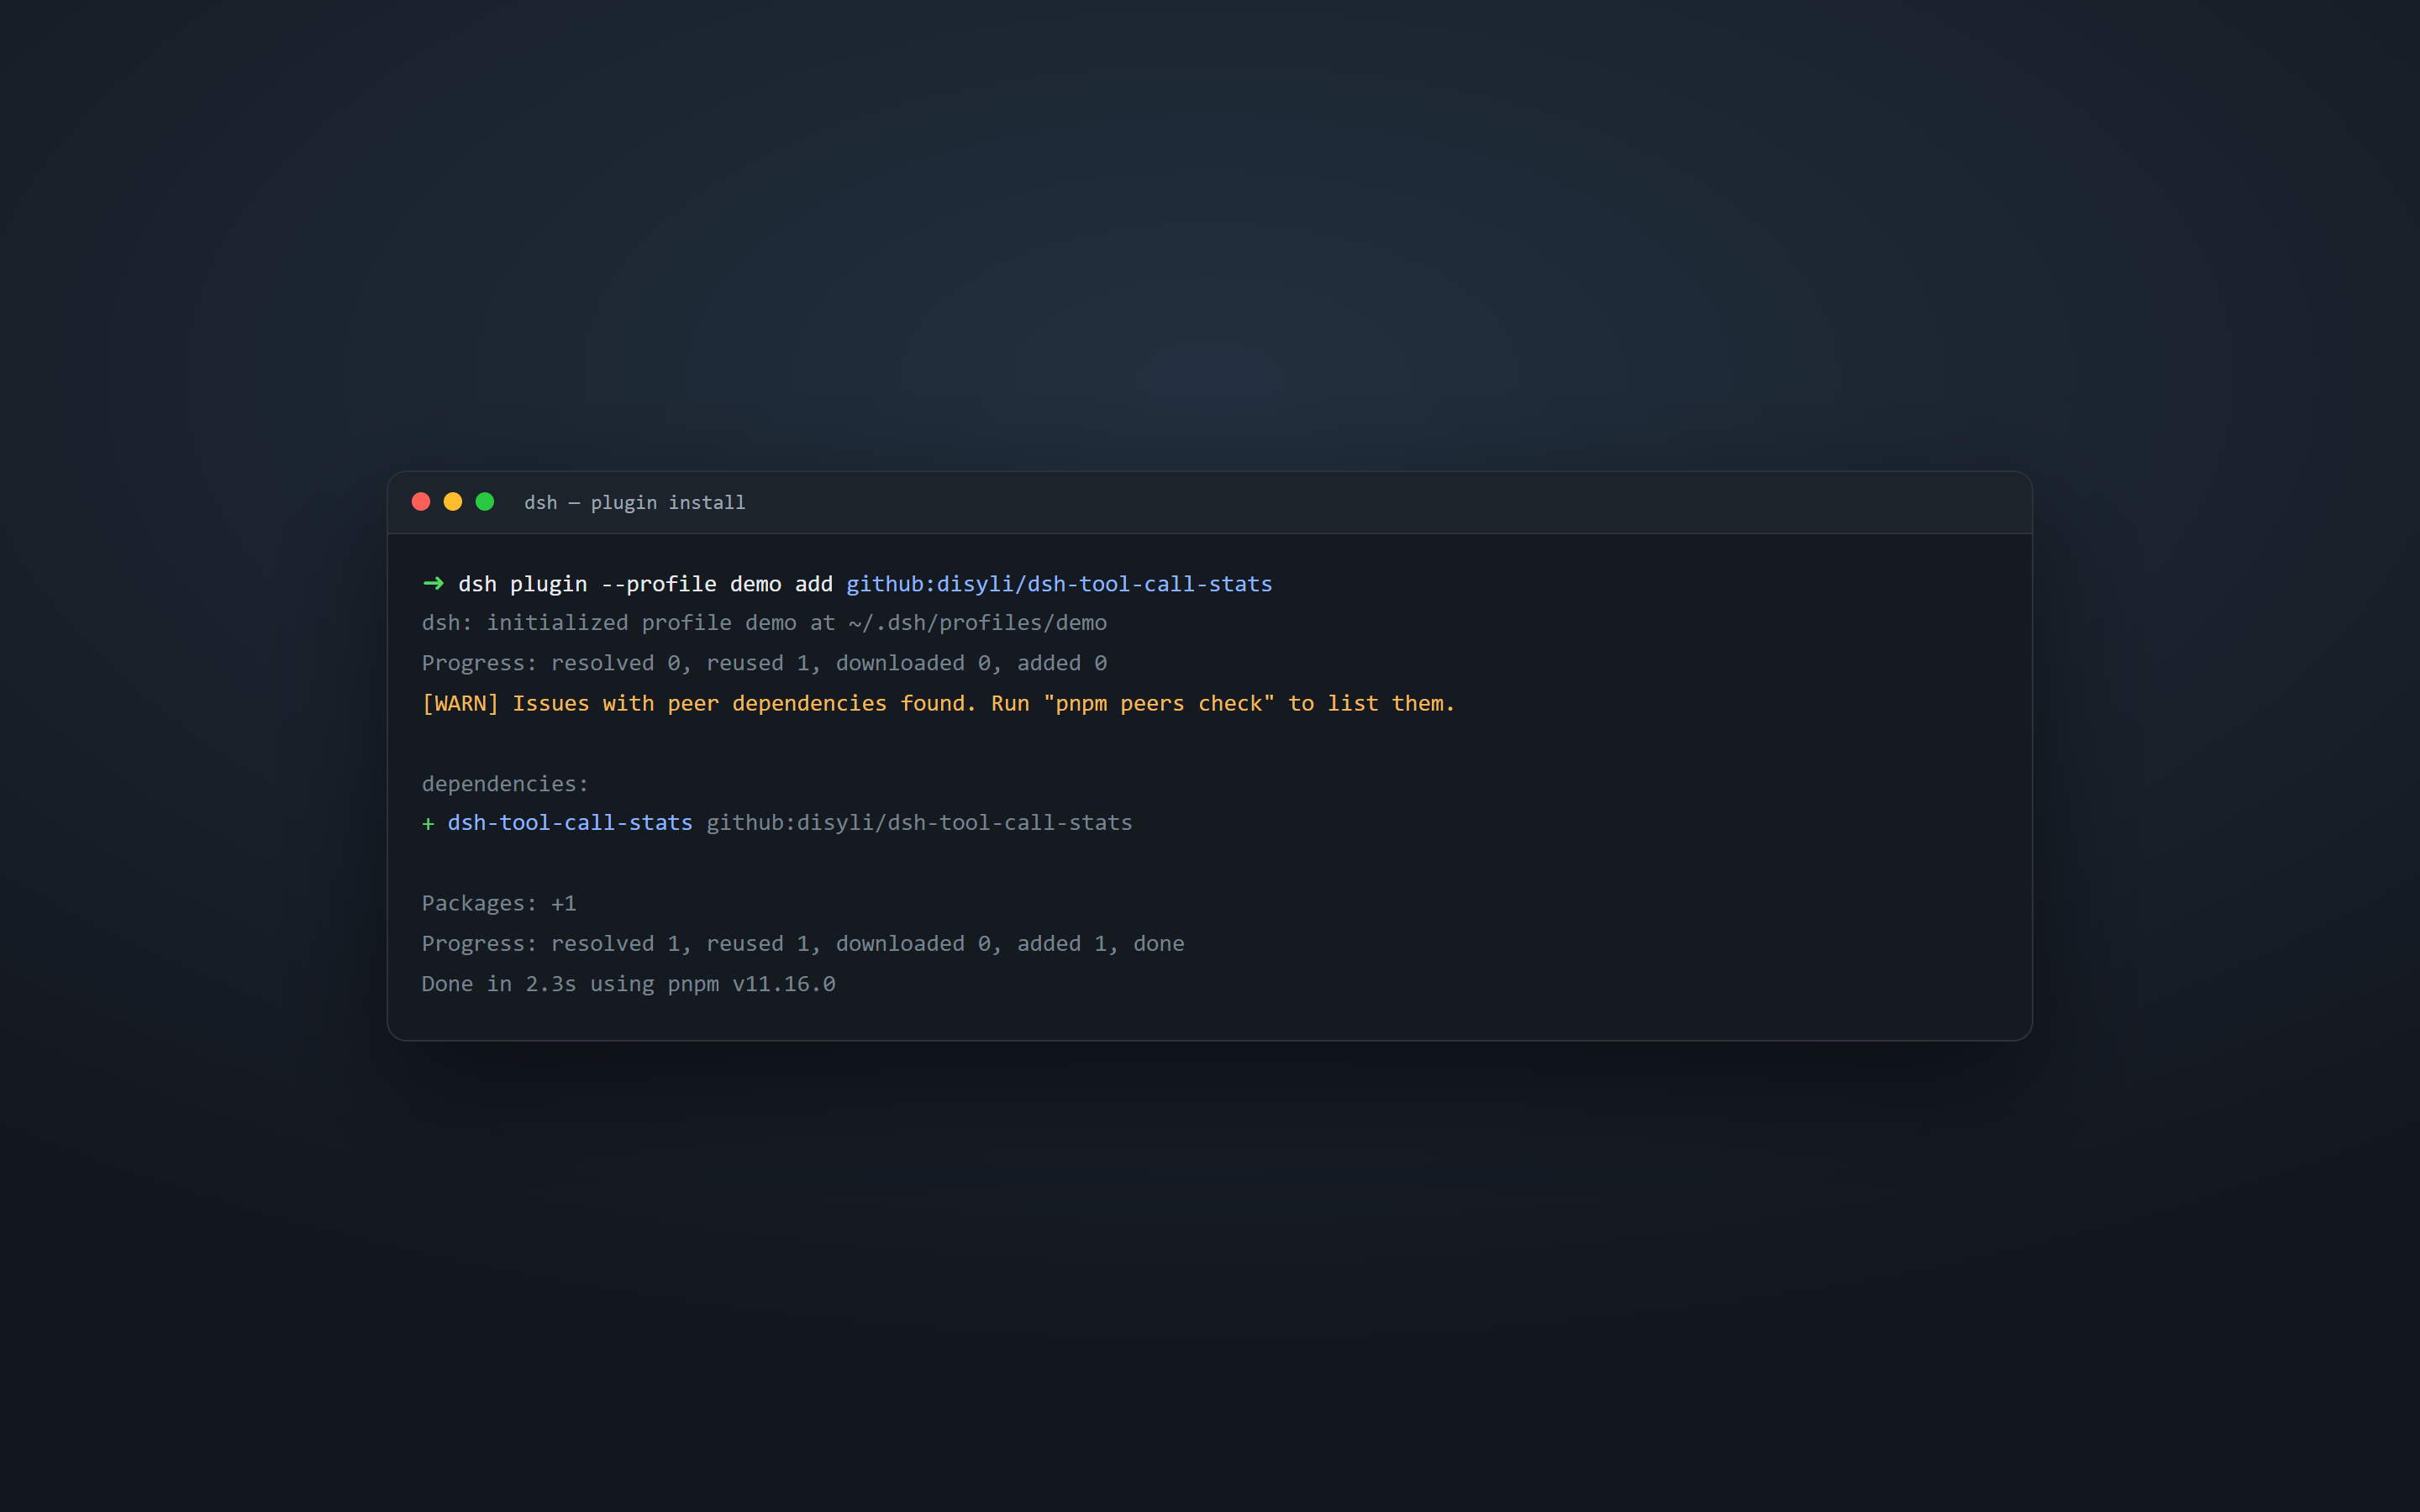
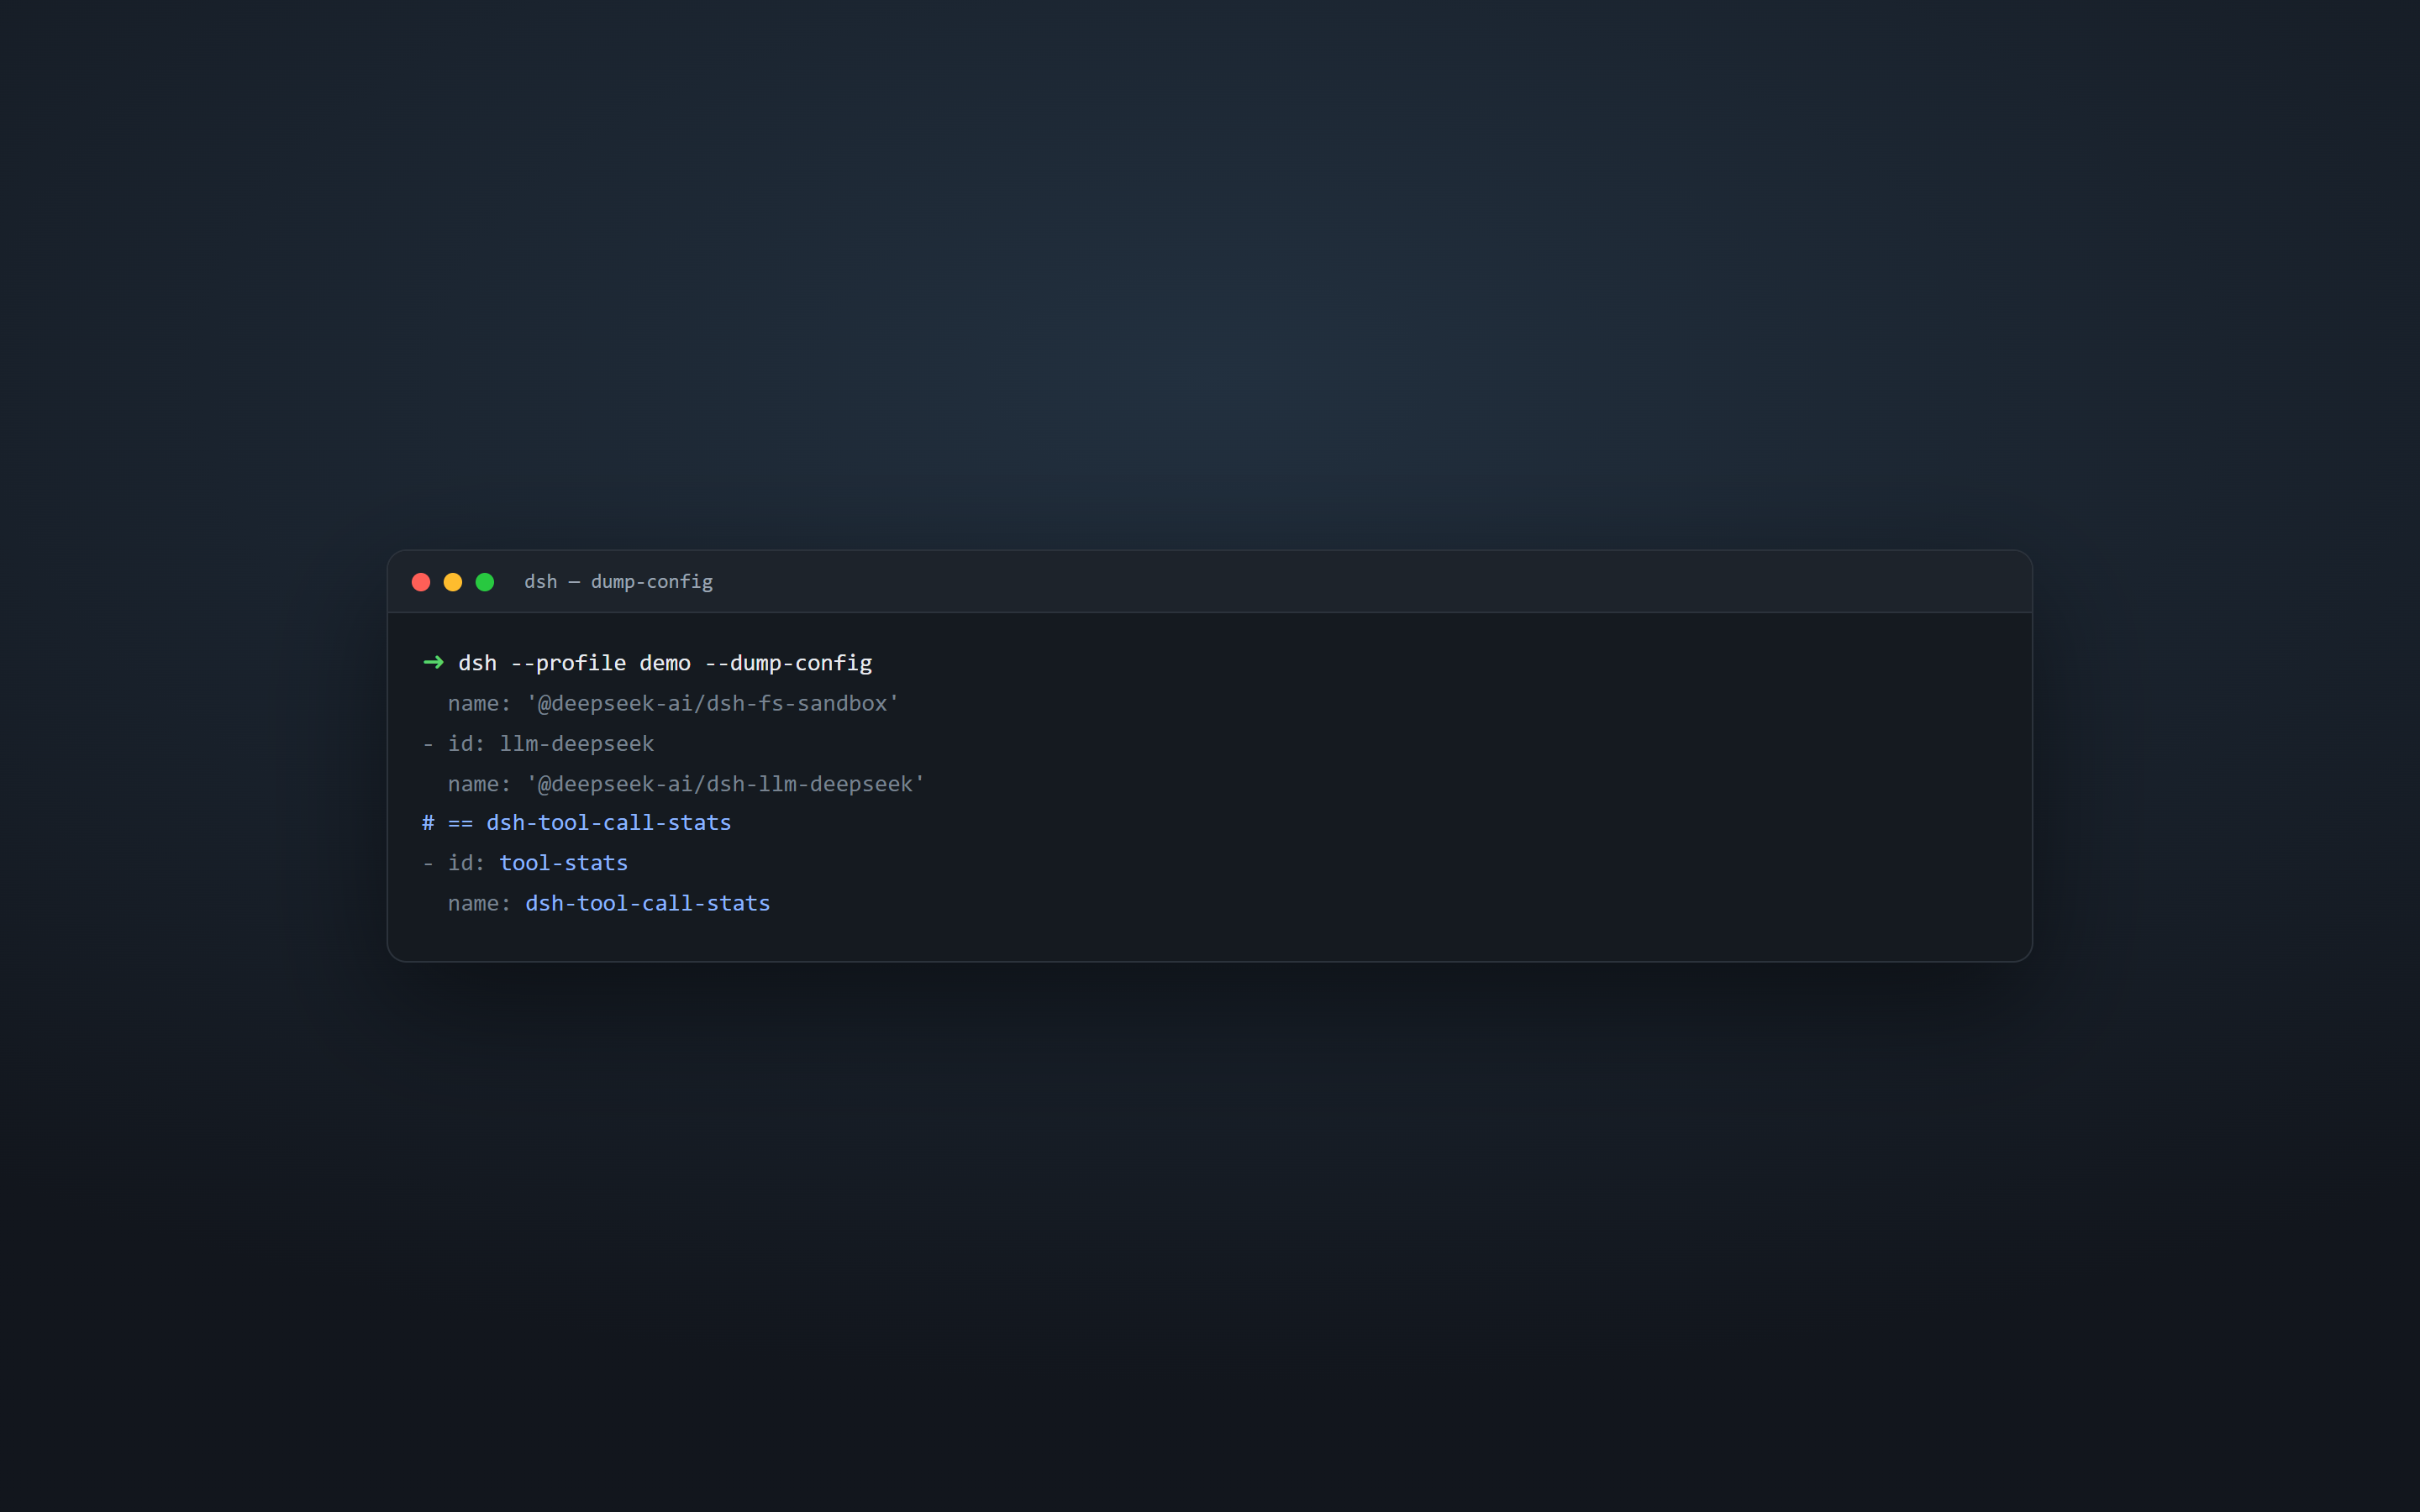
README
目录
A tiny community plugin for DeepSeek Harness (dsh).
It records every committed tool call in the current harness process and exposes a tool_stats tool, so the model (or you) can ask at any point:
Which tools were used, how often did they fail, and where did the time go?
Not to be confused with the token/cost trackers in the ecosystem (dsh-token-stats, dsh-usage-report, ...) — this plugin counts tool-call dispatches, not tokens. Also unrelated to dsh-tool-stat (a descriptive-statistics math tool).
Status: built and verified end-to-end against the dsh v0.1 developer preview (headless profile, live DeepSeek session): both event listeners record real dispatches and
tool_statsreturns the table below. Upstream interfaces may still change during the preview.
Example output (from the verification run):
tool  calls  errors  avg_ms
----  -----  ------  ------
bash  1      0       23
read  1      0       8
How it works
Everything in dsh is a plugin, and this one is deliberately minimal — three seams, ~100 lines, no build step:
tools/execute(waterfall): wraps each dispatch to record its start time, then delegates vianext().tools/result(observer): counts each committed result per tool name and accumulates duration;result.isErrordrives the error counter.ctx.tools.register(defineTool(...)): exposestool_stats, which returns a canonical JSON array (output.schema) and renders a plain-text table for the model.
All state is in-memory and process-local. Nothing is persisted; restarting dsh resets the counters. When the plugin is unloaded, Cordis disposes both listeners and the tool automatically — no manual cleanup code.
Install
Into a profile (recommended)
dsh plugin --profile <name> add github:disyli/dsh-tool-call-stats
pnpm ≥ 10 will ask you to allow the package before running install scripts (this package has none, but the prompt may still gate the git install). Follow the hint dsh prints, then re-run add.
Verify the layer and start:
dsh --profile <name> --dump-config   # shows a "# == dsh-tool-call-stats" layer
dsh --profile <name>
As a local overlay (source checkout)
From a deepseek-harness checkout, point a patch at the local file:
# stats.cordis.yml
- insert:
    - id: tool-stats
      name: '/absolute/path/to/dsh-tool-call-stats/index.js'
pnpm dsh web --patch ./stats.cordis.yml
Use
Ask the agent things like:
- "Use tool_stats to show tool usage so far."
- "Which tool failed the most in this session?"
Limitations
- Process-local only: counters reset on restart and are not shared across sessions.
- Calls aborted before the registry commits a result are not counted (their timing entries are garbage-collected after 10 s).
- Built against the dsh v0.1 developer preview; upstream interfaces may change ("THERE WILL BE COMPATIBILITY-BREAKING CHANGES").
License
MIT
原始 README: https://github.com/disyli/dsh-tool-call-stats/blob/main/README.md ↗
同类插件
查看全部 →
k8e
k8e.sh — 开源 Agentic AI 沙箱矩阵

hol-guard
开源AI代理防病毒:运行时拦截风险工具、秘密访问、提示注入、恶意软件包、MCP服务器、插件和技能。

anolisa
ANOLISA(Agentic Nexus Operating Layer & Interface System Architecture):具备运行时、安全性、可观测性和 Tokenless 响应压缩能力的 Agentic OS,可降低 Token 使用量与成本。

mobius
首个自我演进的开源 Agent OS:连接你的团队、AI agent、设备与算力

deepseek-harness-desktop
DeepSeek Harness Tauri 桌面版 | Only 5mb installer, zero environment setup. Windows / macOS / Linux.

open-managed-agents
开源Claude管理代理API实现和自托管Claude标签式代理运行时。即插即用;在Cloudflare Workers/Durable Objects或Node.js上运行。Apache 2.0。